

Over the past few years, home prices skyrocketed. That’s been frustrating for buyers, leaving many wondering if they’d ever get a shot at owning a home. But here’s some welcome news: that whirlwind pace of home price growth is slowing down.
Home Prices Are Rising at a Healthy Pace
At the national level, home prices are still going up, but at a much more moderate, normal pace. For example, in November, the year-over-year increase in home prices was just 3.8% nationally, according to Case-Shiller. That’s a far cry from the double-digit spikes that occurred in 2021 and 2022 (see graph below):

This more normal home price growth might make buying a home feel more attainable for many buyers. You won’t face the same sticker shock or rapid price jumps that made it hard to plan your purchase just a few years ago.
At the same time, steady growth means the home you buy today will likely appreciate in value over time.
Prices Vary from Market to Market
While the national story is one of moderate price growth, it’s important to remember that all real estate is local. Some markets are seeing stronger growth, while others are cooling off or even seeing slight declines. As Selma Hepp, Chief Economist at CoreLogic, notes:
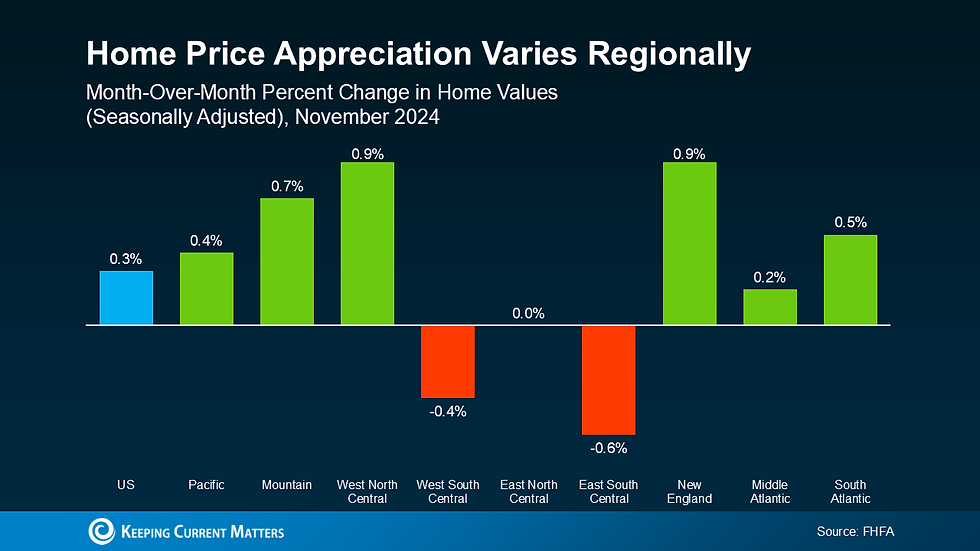
“Regionally, variations persist, as some affordable areas – including smaller metros in the Midwest — remain in high demand and continue to see upward home price pressures.”
Meanwhile, other regions saw slight month-over-month declines in November, according to Federal Housing Finance Agency (FHFA) data (see graph below):
What does this mean for you? It’s crucial to understand what’s happening in your local market. A national average can’t tell the whole story. That’s where working with a local real estate agent can really help. They have the tools and expertise to give you the full picture of what’s happening in your area and how to plan for that in your move.
Comments